 Mohamed Algarj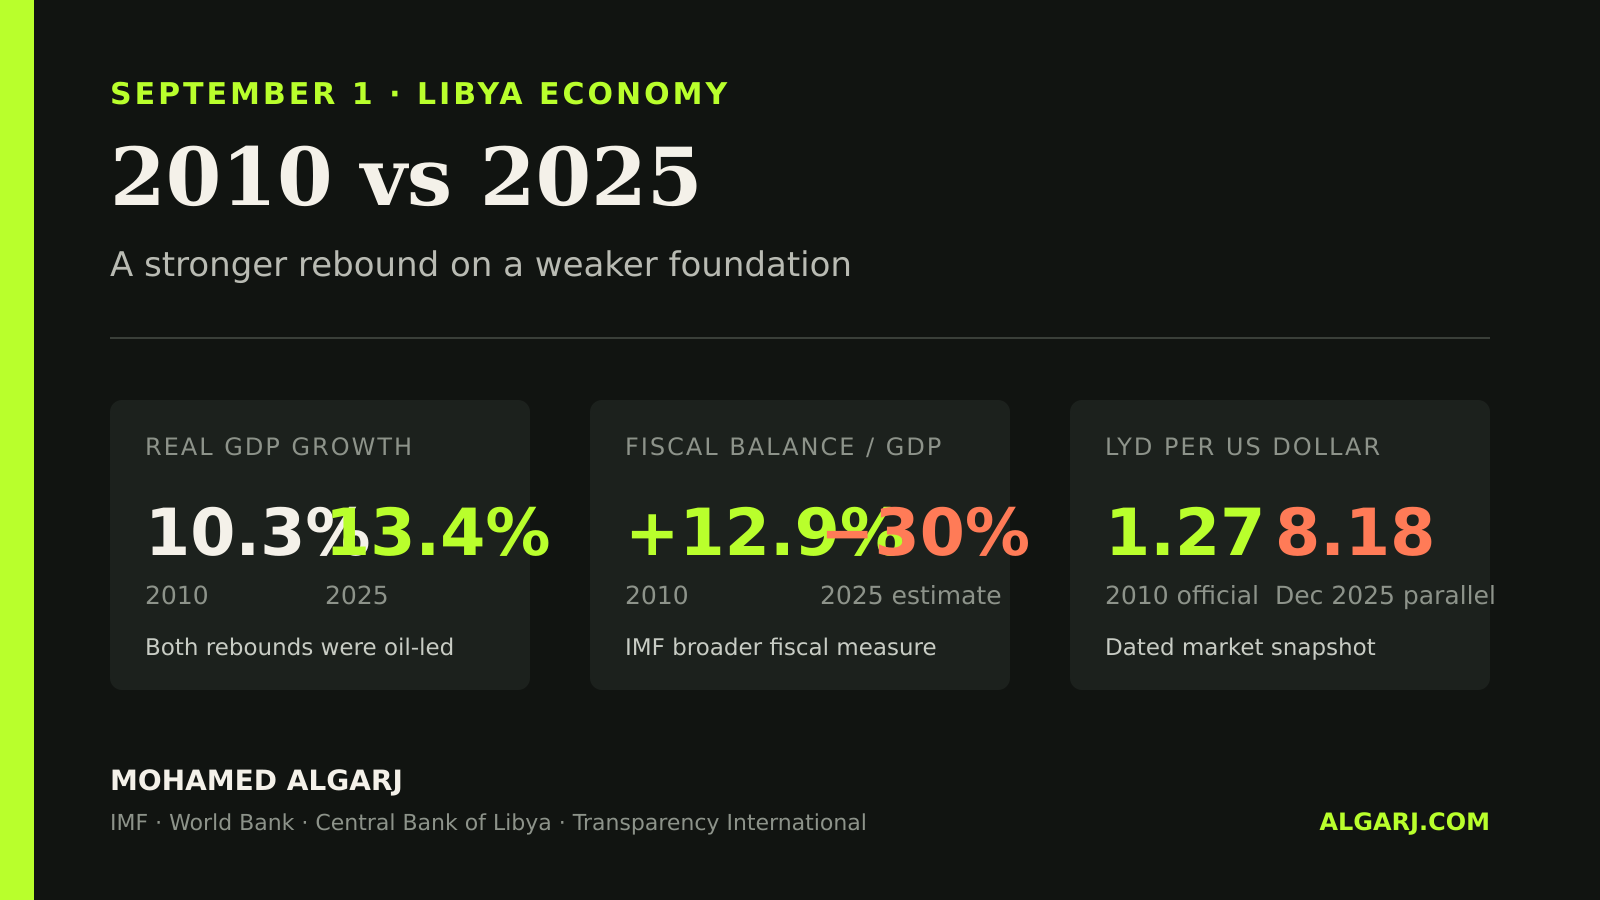
On September 1, the anniversary of the 1969 proclamation officially known as the al-Fateh Revolution, Libya’s economic debate usually collapses into two rival memories: a state that accumulated oil wealth before 2011, or a system that failed to turn that wealth into a diversified economy.
The data supports neither nostalgia nor erasure. The last full pre-war year, 2010, was economically stronger in several fundamental respects: the budget and current account were in large surplus, the dinar was stable, and output per person in current dollars was substantially higher. But it was also an oil-dependent state with weak financial intermediation, high youth unemployment and an underdeveloped private sector.
By 2025, Libya had restored oil output strongly enough to record faster headline growth than in 2010. Yet that rebound sat on a weaker fiscal, monetary and institutional base. The central finding is therefore not that every indicator was better under the former system. It is that fifteen years failed to convert oil wealth into resilience—and Libya entered another oil upswing with a weaker dinar, lower dollar GDP per person and much larger fiscal imbalances.
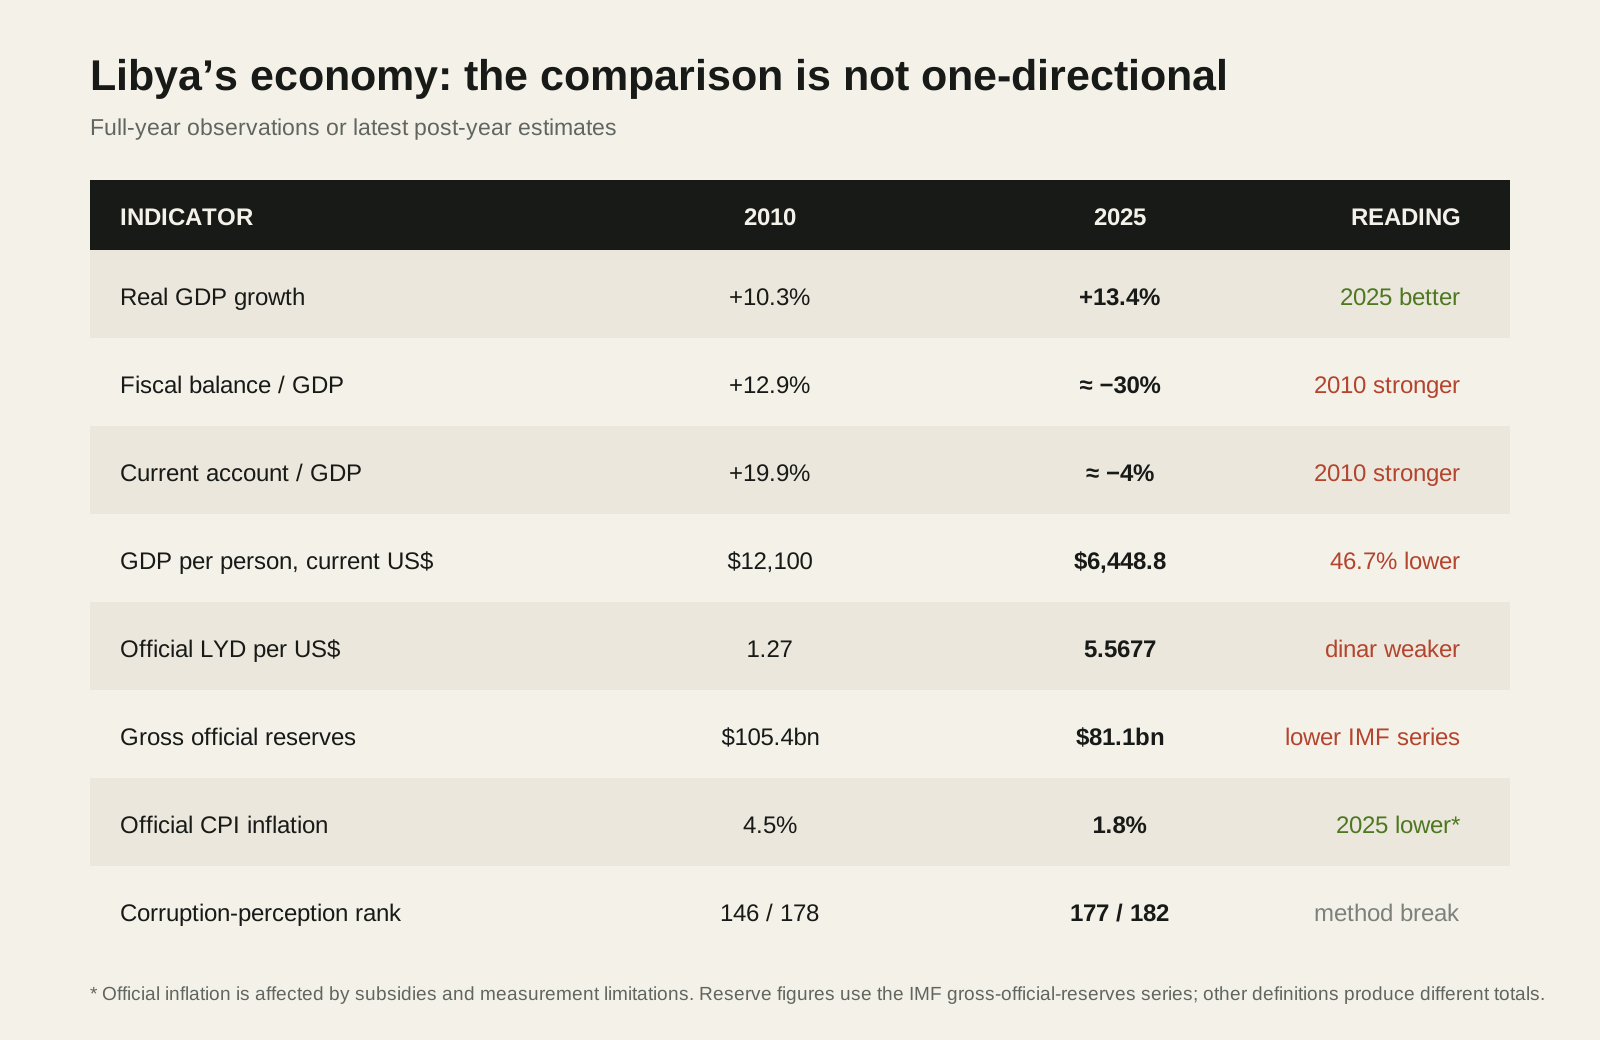
| Indicator | 2010 | 2025 | Evidence-based reading |
|---|---|---|---|
| Real GDP growth | +10.3% | +13.4% | 2025 was higher; both rebounds were oil-led |
| Overall fiscal balance | +12.9% of GDP | about −30% of GDP | Large surplus became a large deficit |
| Current-account balance | +19.9% of GDP | about −4% of GDP | External surplus became an estimated deficit |
| GDP per capita, current US$ | $12,100 | $6,448.8 | 46.7% lower in nominal dollar terms |
| Official USD rate | LYD 1.27 | LYD 5.5677 | Posted dollar cost was 4.4 times higher |
| Gross official reserves, IMF series | $105.4bn | $81.1bn | Import cover: 36.9 vs about 31 months |
| Consumer-price inflation | 4.5% | 1.8% | 2025 official average was lower, with measurement caveats |
| Corruption-perception rank | 146/178 | 177/182 | Both were poor; methodology changed after 2010 |
 Enlarge figure ↗
Growth: 2025 Was Stronger—But It Was Not a Structural Break
Real GDP grew 10.3% in 2010. Hydrocarbon output expanded 14%, while non-hydrocarbon activity grew 7%, supported partly by large public expenditure. The IMF explicitly linked the overall acceleration to a sharp rise in oil production.
The World Bank now reports 13.4% growth in 2025: oil GDP expanded 17.4% and non-oil activity 6.9%. It would therefore be inaccurate to describe 2025 as a year of economic contraction or to claim that 2010 had the stronger one-year growth number.
But the composition matters. In both years, the dominant engine was oil. The World Bank says hydrocarbons remained the defining feature of the economy and the private sector employed only 14% of the workforce in 2025. Libya recovered output; it did not escape the mechanism that makes national income rise or fall with wells, ports and oil prices.
The Fiscal Reversal Is the Sharpest Difference
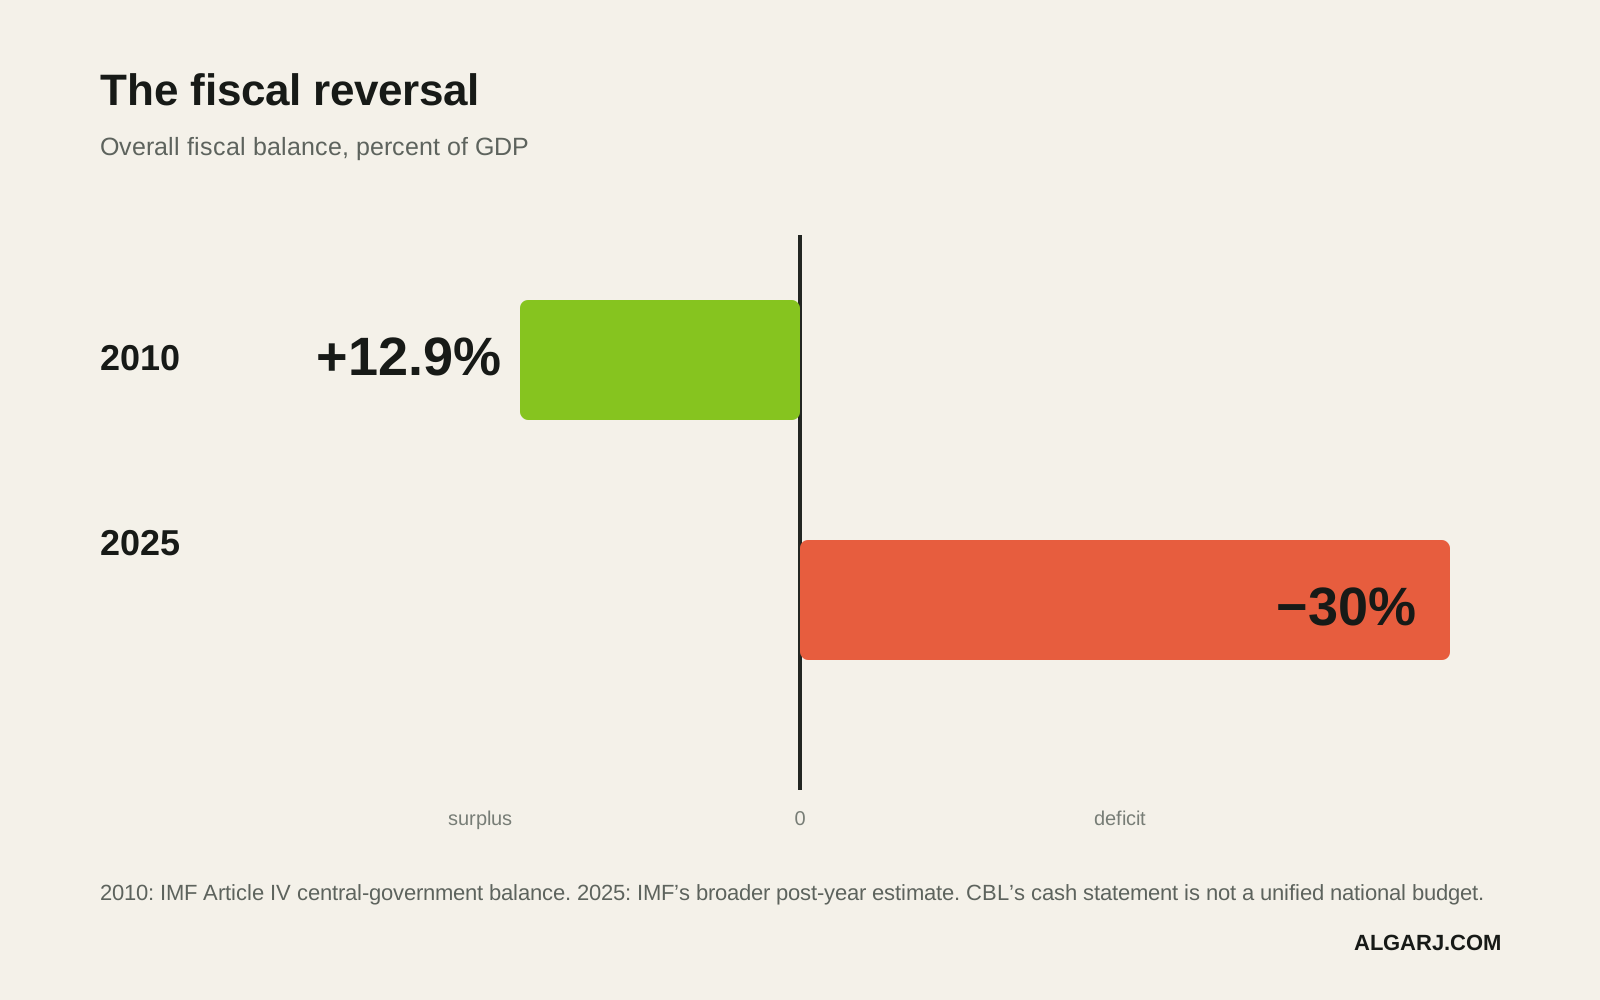
In 2010, central-government revenue reached 61% of GDP and expenditure 48.1%, leaving an overall surplus of 12.9% of GDP. Hydrocarbon revenue alone equalled 55% of GDP.
The Central Bank’s 2025 cash statement records LYD 136.52 billion in revenue and LYD 136.8 billion in expenditure—a narrow cash gap of roughly LYD 276 million. Read alone, that statement appears close to balance. It is not, however, a consolidated national budget.
The IMF’s broader assessment, published after the year closed, estimates that fiscal deficits reached about 30% of GDP in 2025 and that public debt rose to 146% of GDP. The World Bank also notes that Libya operated without a unified 2025 budget and relied on monthly allocations. The difference between the Central Bank cash statement and the IMF estimate is therefore a coverage and consolidation problem, not a rounding error.
 Enlarge figure ↗
The structure of recorded spending is equally revealing. Wages consumed LYD 73.3 billion and subsidies LYD 34.5 billion. Together they absorbed 78.8% of the LYD 136.8 billion total. Development received LYD 20 billion, or 14.6%, and goods and services LYD 9 billion, or 6.6%.
In other words, Libya’s public finances became larger as a distribution system while remaining weak as an investment system.
From External Surplus to External Pressure
The 2010 current account recorded a surplus of $15.5 billion, equivalent to 19.9% of GDP. Exports were almost twice imports, and hydrocarbons represented 96.9% of export receipts.
The latest World Bank quantitative estimate placed the 2025 current-account balance at roughly −4% of GDP. This is an estimate rather than a final audited national account, but it is consistent with the IMF’s later description of high external deficits and persistent foreign-currency pressure.
The direction is clear: a country that once accumulated a large share of annual income externally was using more of its foreign inflows to sustain imports and domestic expenditure.
The Dinar: From an Anchor to Multiple Prices
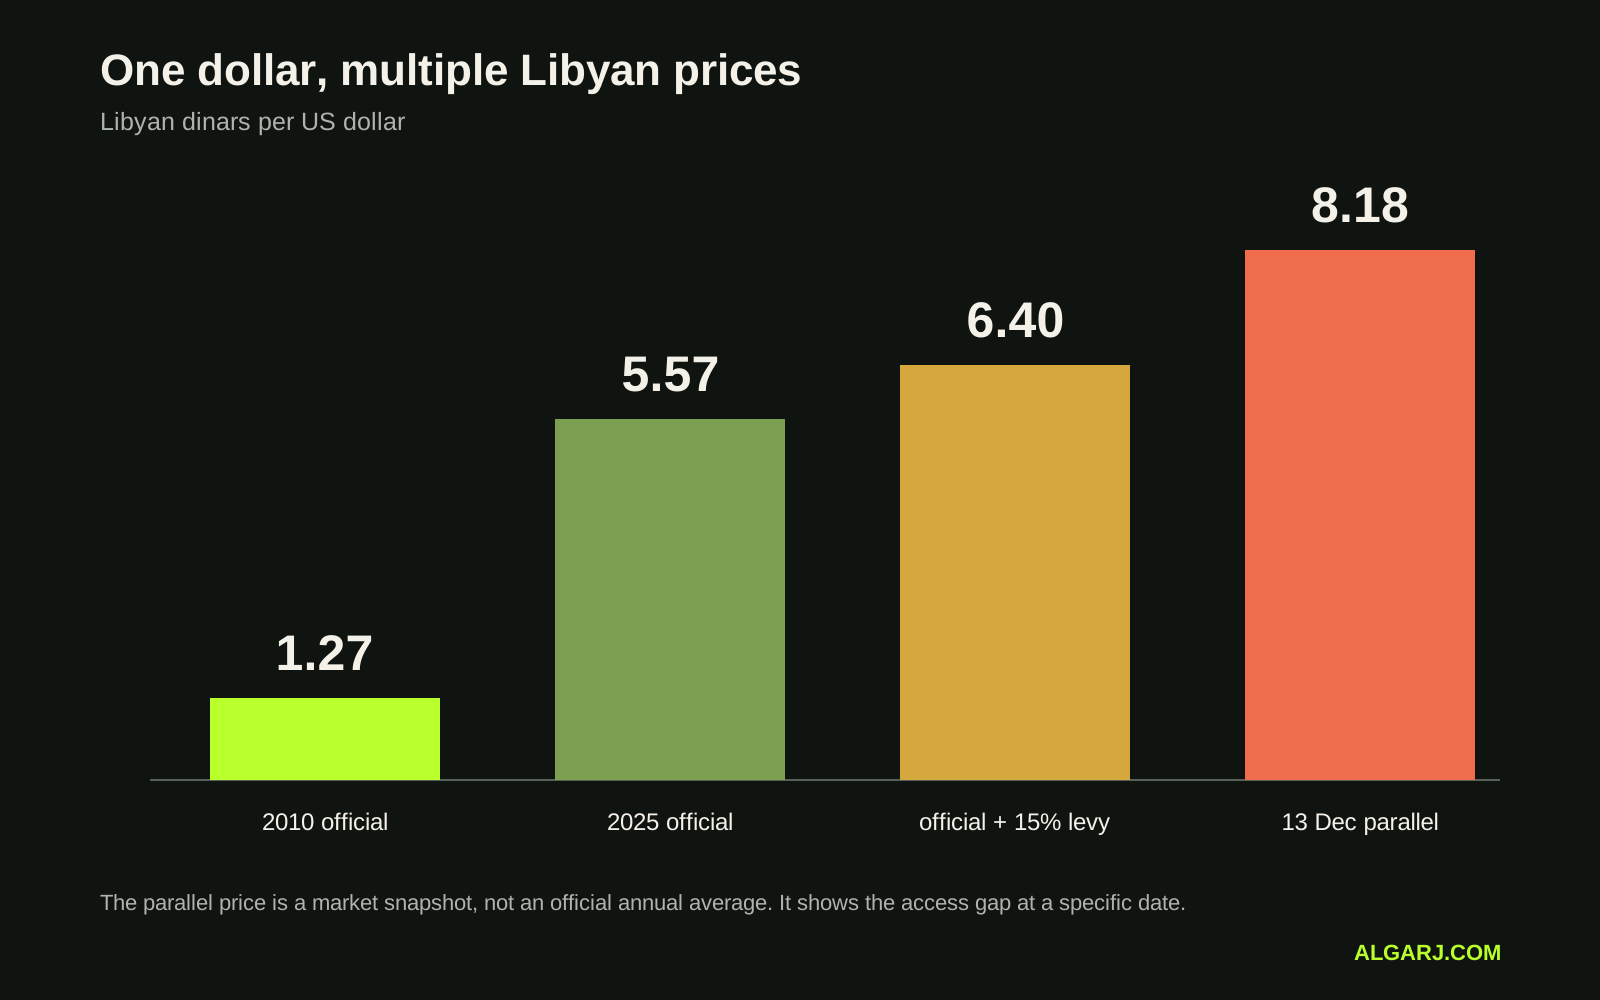
At the end of 2010, the official rate was approximately LYD 1.27 per US dollar, and the IMF assessed the exchange rate as broadly aligned with fundamentals.
In April 2025, the Central Bank devalued the dinar by 13.3%, taking the posted official rate to approximately LYD 5.5677 per dollar. With the 15% foreign-exchange levy then applied, the effective cost through official channels was about LYD 6.40. A December 13 market snapshot published by the Libya Observer put the parallel rate at LYD 8.18.
 Enlarge figure ↗
Relative to the end-2010 official rate, the dollar cost 4.4 times more at the posted 2025 rate, about five times more after the levy, and 6.4 times more in that parallel-market snapshot. The existence of three economically relevant prices also shows that the problem is no longer only the level of the exchange rate; it is unequal access to each rate.
Reserves: One Number Cannot Carry the Argument
A widely repeated comparison says Libya’s reserves fell from $152 billion in 2010 to a much smaller modern figure. That comparison is methodologically unsafe.
The IMF’s 2010 table reported $152.4 billion in total foreign assets including Libyan Investment Authority investments. Within that total, gross official reserves were $105.4 billion, covering 36.9 months of the following year’s imports. These are not the same reserve concept.
For 2025, the IMF’s comparable gross-official-reserves series estimated $81.1 billion, or roughly 31 months of imports. A different World Bank series—total reserves including gold—reports about $104.7 billion. Gold revaluation materially supported the dollar value of the stock, and the IMF notes that its reserve measure also includes sizeable LIA deposits at the Central Bank.
The defensible conclusion is narrower: Libya still possessed a large external buffer, but the comparable IMF measure and import cover were lower than in 2010. A precise claim of “$63 billion lost” cannot be supported by mixing official reserves, total foreign assets, gold valuation and LIA investments.
Income per Person Fell Even as Oil Returned
GDP per capita was $12,100 in 2010. The World Bank reports $6,448.8 in 2025, a nominal dollar decline of approximately 46.7%.
This is not household income, and it is affected by oil prices and exchange-rate conversion. But it remains a useful national indicator: the current-dollar value of output produced per resident was almost half its 2010 level, despite the strong 2025 growth rate.
The contrast explains why headline growth can coexist with economic frustration. Growth measures the change from the previous year; GDP per capita measures the size of output relative to the population. A rebound from a weaker base does not restore the earlier level automatically.
Oil Dependence Changed Form, Not Function
In 2010, hydrocarbon revenue accounted for roughly 90.2% of total government revenue, and oil supplied 96.9% of exports.
In the Central Bank’s 2025 statement, oil revenue and royalties totalled LYD 116.8 billion, or 85.5% of recorded revenue. That apparently lower share is not evidence of successful diversification. LYD 12 billion of “other revenue” came from the foreign-exchange levy, while taxes, customs and telecommunications receipts together represented only about 2.5% of total recorded revenue.
The state diversified its accounting more than its productive base. It still finances wages, subsidies and imports by converting oil dollars into dinars.
Inflation and Corruption Require Honest Caveats
Official consumer-price inflation was 4.5% in 2010 and 1.8% in 2025 according to the World Bank series. On that narrow measure, 2025 was better. But the IMF has warned that Libya’s index has been affected by subsidies, an outdated consumption basket and historically limited geographic coverage. Low official inflation therefore should not be presented as proof that household purchasing power improved while the dinar weakened.
Libya ranked 146th of 178 countries in Transparency International’s 2010 Corruption Perceptions Index, with 2.2 points out of 10. In the 2025 index it scored 13 out of 100 and ranked 177th of 182. Because Transparency International changed the methodology in 2012, the two scores are not directly comparable as a continuous numerical series. What can be said safely is that Libya was poorly ranked in both years and stood much closer to the bottom of the global table in 2025.
The Verdict: A Higher Growth Rate on a Weaker Foundation
The evidence does not support the slogan that every economic indicator was better in 2010. Growth was higher in 2025, and measured inflation was lower. Nor does it support presenting 2010 as a diversified success: the economy was oil-dominated, finance was shallow, youth unemployment was high and the private sector remained weak.
What the comparison does show is more consequential. Libya entered 2011 with large fiscal and external surpluses, a stable currency and substantially higher current-dollar output per person. Fifteen years later, it produced another oil-led rebound without building the institutions capable of converting that rebound into fiscal discipline, currency confidence and productive diversification.
The failure is not that Libya stopped producing oil. It is that the country repeatedly returned to the same oil cycle with a weaker state balance sheet and fewer policy buffers.
On this September 1 anniversary, the useful question is not which political memory wins. It is why a country that possessed the financial space to transform its economy still measures success by restoring the same barrels—and why that recovery has not restored the citizen’s purchasing power, services or economic security.
Mohamed Alssed Mohamed Algarj
Methodology: Full-year 2010 is compared with full-year 2025 wherever available. IMF staff estimates and World Bank updates are identified as such. Fiscal cash statements are kept separate from consolidated fiscal estimates; reserve concepts are not combined; the parallel exchange rate is a dated market snapshot, not an official annual average. Percentages calculated from published components may differ slightly because of rounding.