 Mohamed Algarj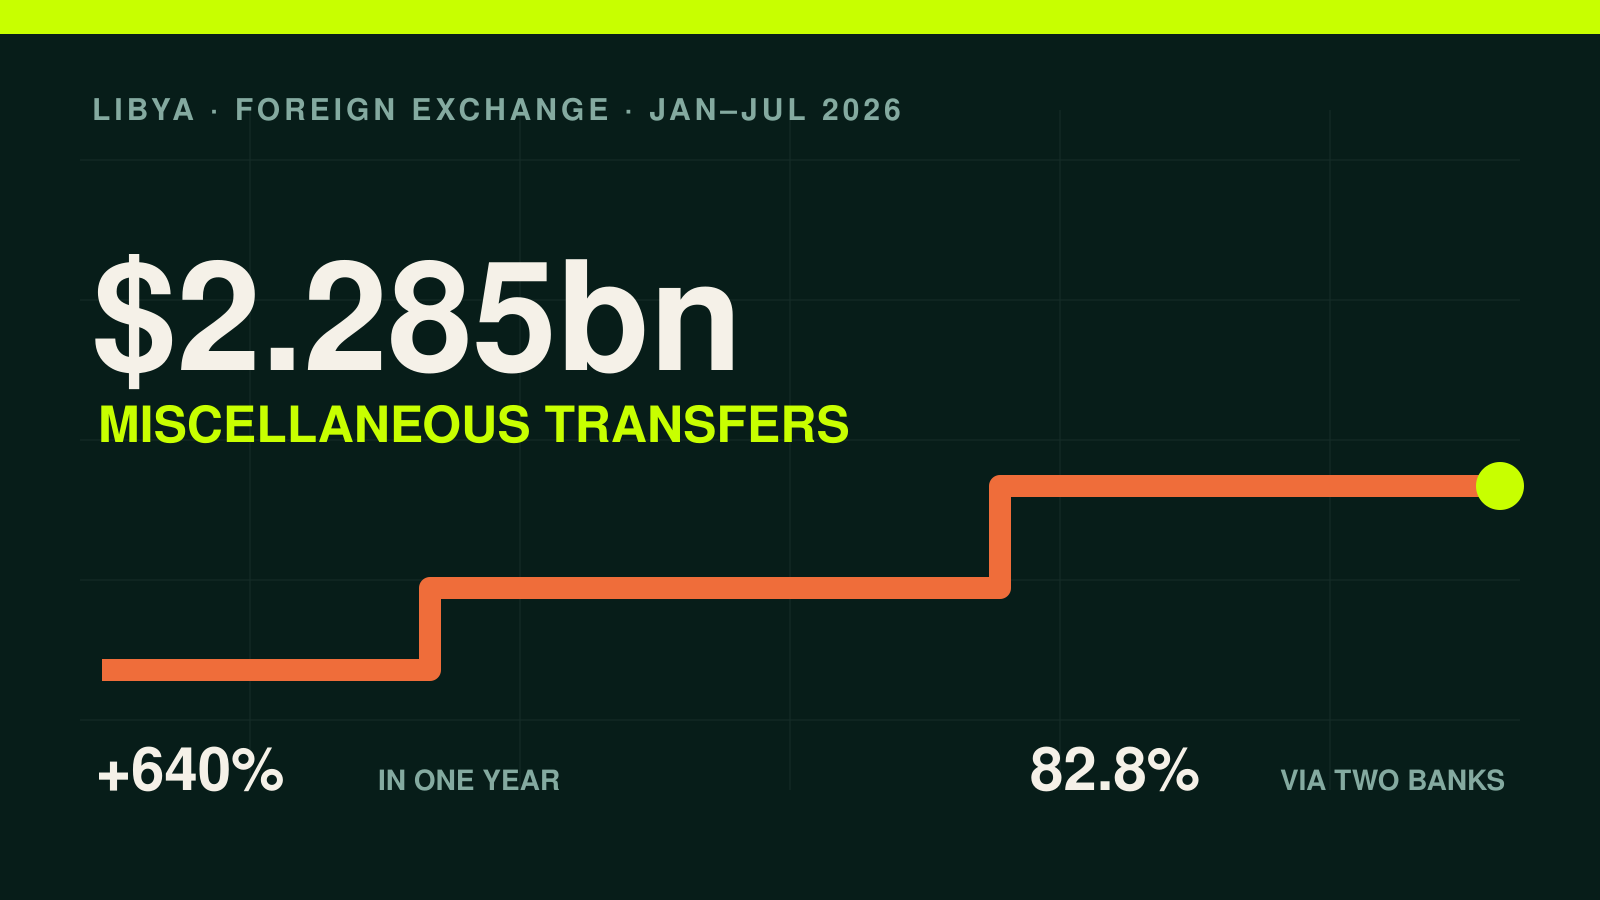
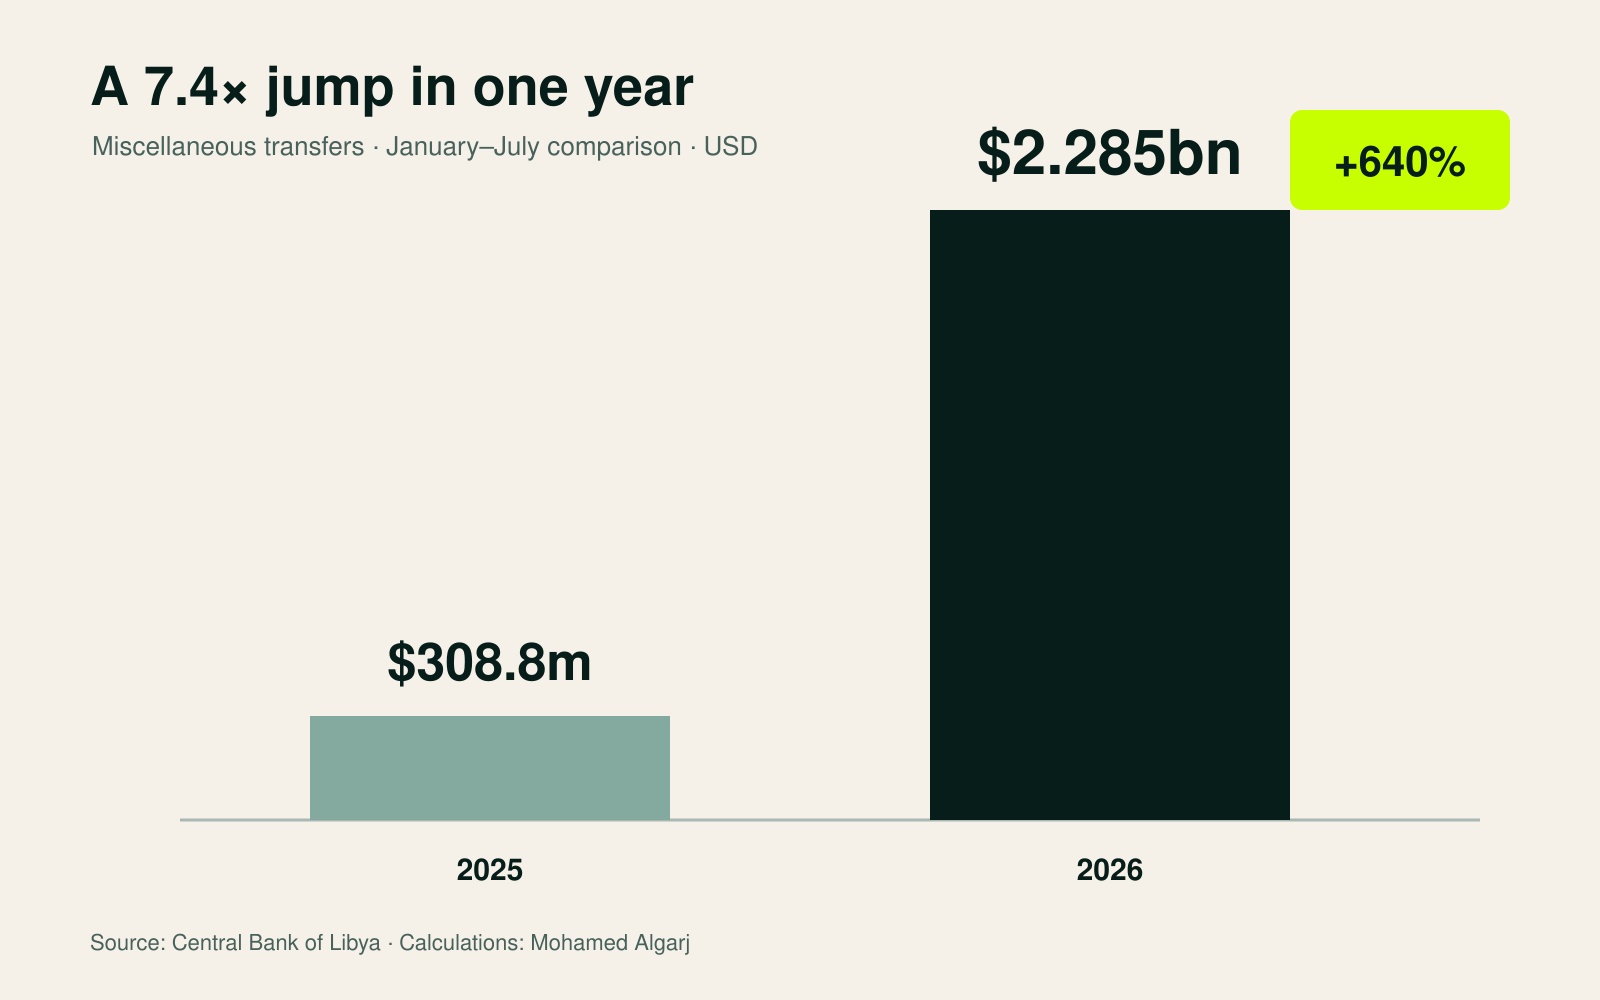
The value of miscellaneous transfers executed by Libyan banks rose from approximately $308.8 million in the first seven months of 2025 to $2.285 billion in the same period of 2026.
That is an increase of $1.976 billion, or approximately 640%, in one year. Put differently, every dollar recorded under this category in the 2025 comparison period became $7.40 in 2026. The seven-month 2026 total was already more than 2.6 times the roughly $877 million reported for all of 2025.
| Indicator | Jan–Jul 2025 | Jan–Jul 2026 | Change |
|---|---|---|---|
| Miscellaneous transfers | $308.8m | $2.285bn | +640% |
| Monthly average | $44.1m | $326.4m | 7.4× |
| Daily average | $1.46m | $10.78m | 7.4× |
| Share of total foreign-currency uses | about 2.0% | 14.3% | +12.3 percentage points |
Dear reader, transfers are not prohibited and their use is not evidence of corruption. They are a normal channel for trade, services, medical treatment, aviation, insurance, salaries and other external obligations. The accountability question is narrower and more important: how did this category rise from $309 million to $2.285 billion in one year without a separately linked public breakdown explaining the change?
More Than $10.7 Million Transferred Per Day
The monthly average rose from $44.1 million to $326.4 million, while the daily average increased from $1.46 million to about $10.78 million. The category’s share of all foreign-currency uses climbed from roughly 2% to 14.3%.
 Enlarge figure ↗
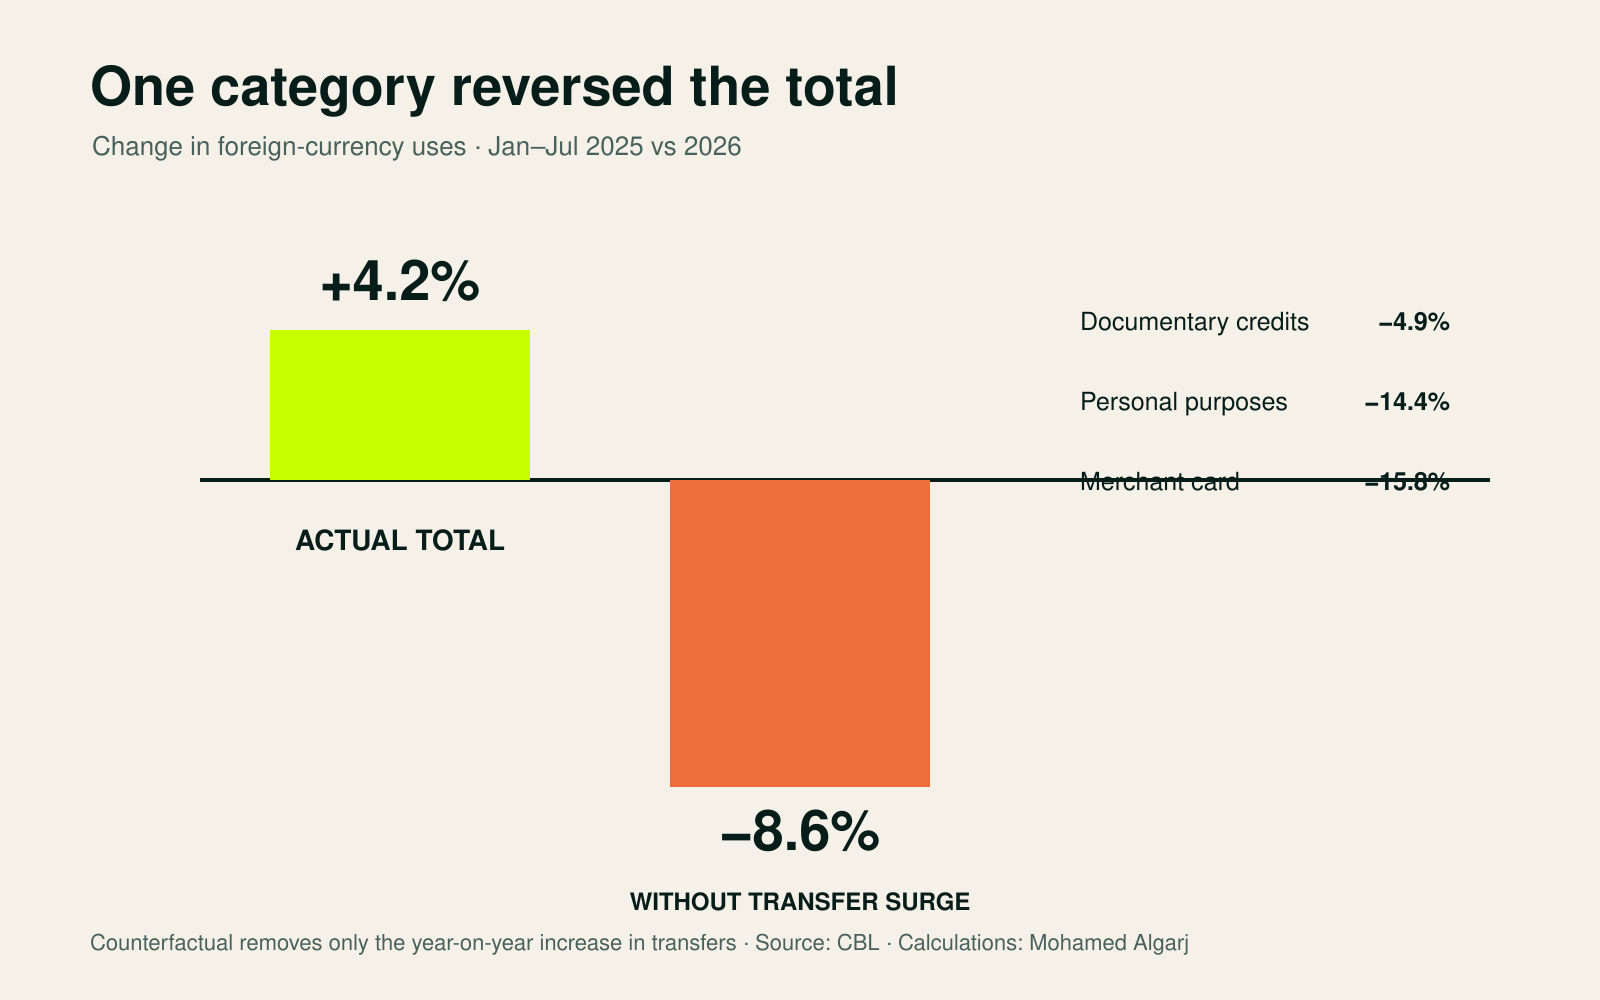
The comparison is striking because the other principal channels moved in the opposite direction. Documentary credits declined 4.9%, personal-purpose allocations fell 14.4%, and merchant-card use declined 15.8%.
Without the $1.976 billion increase in miscellaneous transfers, total foreign-currency uses would have fallen by approximately 8.6%. With it, the published total rose 4.2%. One category therefore reversed the direction of the aggregate figure.
 Enlarge figure ↗
This arithmetic does not explain why the transfers increased. It identifies the category that requires explanation.
82.8% Was Executed Through Two Banks
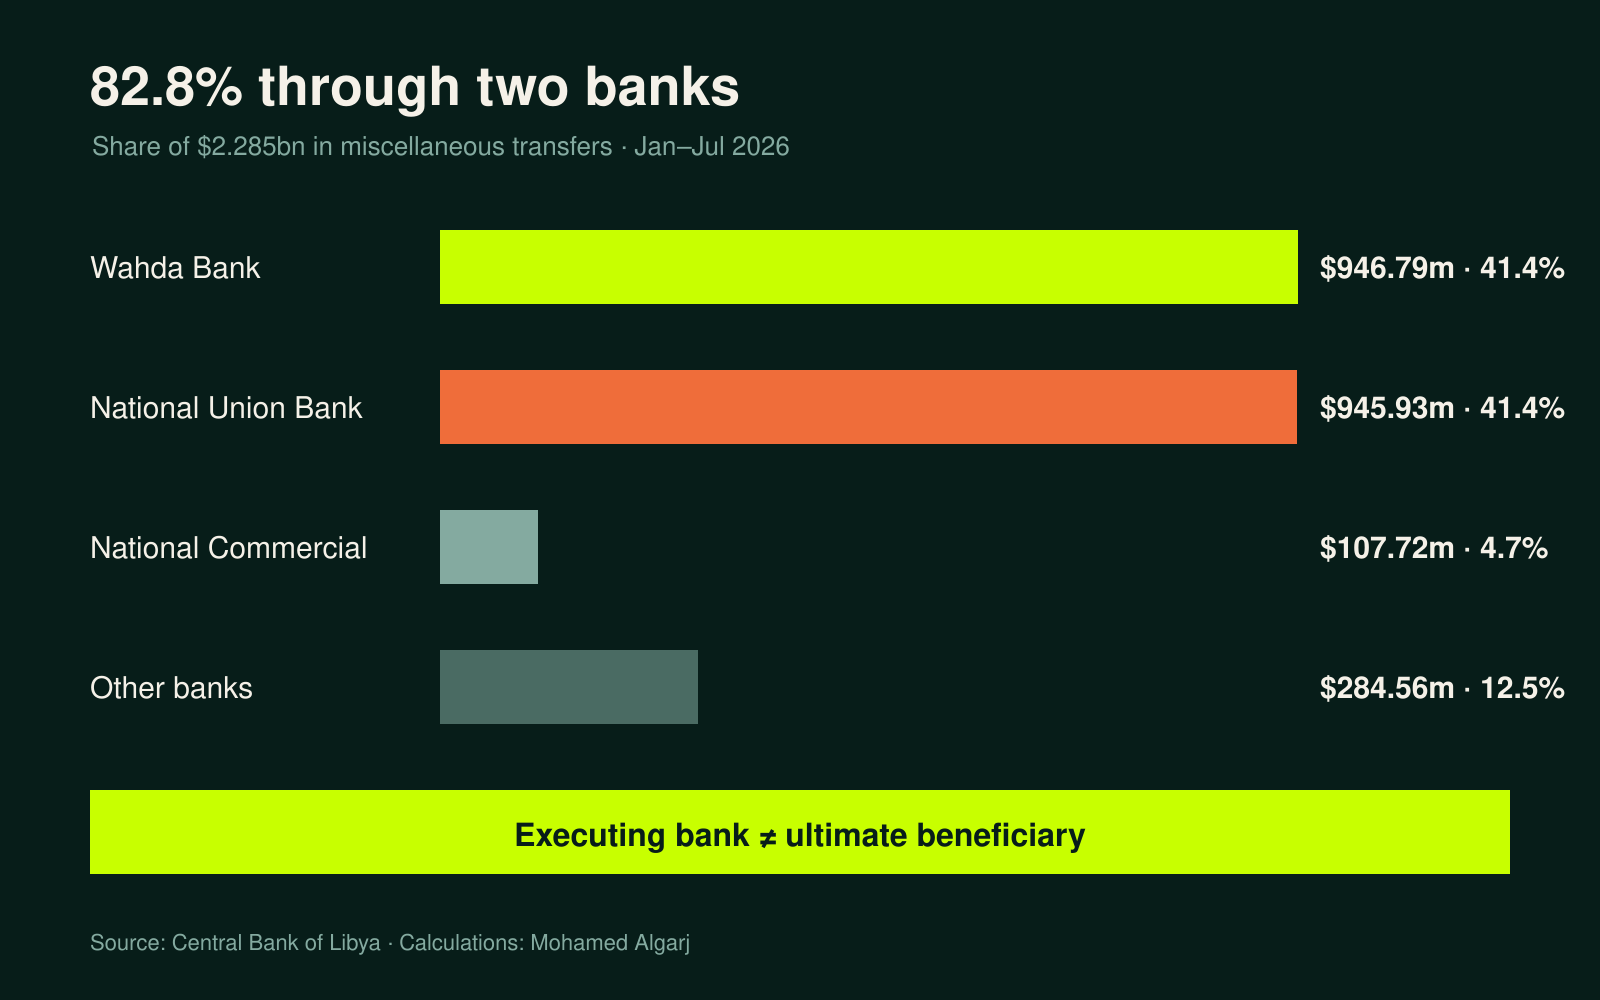
Wahda Bank executed $946.79 million in miscellaneous transfers and National Union Bank executed $945.93 million. Together they accounted for approximately $1.893 billion, or 82.8% of the banking system’s total.
Adding National Commercial Bank’s $107.72 million lifts the top-three share to more than $2 billion, or 87.6%. The remaining banks together accounted for approximately $284.56 million.
| Executing bank | Miscellaneous transfers | Share of total |
|---|---|---|
| Wahda Bank | $946.79m | 41.4% |
| National Union Bank | $945.93m | 41.4% |
| National Commercial Bank | $107.72m | 4.7% |
| Other banks combined | $284.56m | 12.5% |
| Total | $2.285bn | 100% |
 Enlarge figure ↗
This concentration does not prove wrongdoing. Banks execute transfers for customers; they are not necessarily the economic beneficiaries. It does, however, make the operational explanation indispensable: why did more than four-fifths of the category pass through two banks?
From $114 Million to $947 Million Inside One Bank
Wahda Bank’s transfers rose from approximately $114.15 million in January–July 2025 to $946.79 million in the same period of 2026—an increase of $832.64 million, with the 2026 figure 8.3 times the earlier amount.
For National Union Bank, the Central Bank’s comparison table records zero under miscellaneous transfers for the 2025 period and $945.93 million for 2026. The increases at Wahda and National Union together account for approximately 90% of the entire system-wide rise.
Several explanations are possible: new correspondent-banking channels, transfers redirected from other banks or instruments, settlement of accumulated obligations, a small number of unusually large customer operations, or a change in classification between documentary credits and transfers. The published report does not provide enough linked data to determine which explanation is correct.
What the Central Bank Disclosed—and What It Did Not Link
The Central Bank’s publication is valuable. It reports the total value of miscellaneous transfers and their distribution by executing bank. It also provides broad request categories, country tables and company-level lists.
The disclosure gap lies in the join between those tables.
| The report publishes | The report does not isolate for the $2.285bn transfer category |
|---|---|
| Executed miscellaneous transfers by bank | Destination country by transfer value |
| Broad types of coverage requests | Purpose linked to each executed transfer |
| Countries benefiting from accepted private-sector requests | Transfer-only beneficiary list |
| Companies and values of accepted requests | Whether each amount was an LC or a direct transfer |
| Combined documentary-credit and transfer data | Accepted versus actually executed transfers on one reconciled record |
The country and company tables combine documentary credits with miscellaneous transfers. They also refer to accepted coverage requests, which are not necessarily identical to transfers actually executed. We can therefore identify the banks through which the transfers passed, but not reliably reconstruct the full route from customer to purpose to destination and final beneficiary.
The Country List Does Not Answer the Transfer Question
The largest destination countries in the combined table of accepted private-sector documentary-credit and transfer requests were the United Arab Emirates at $2.096 billion, Türkiye at $1.740 billion, Egypt at $920.23 million, China at $683.30 million and Switzerland at $641.03 million.
Those figures must not be presented as the destination breakdown of miscellaneous transfers. They combine two different financing instruments. Assigning the $2.285 billion transfer total to those countries would therefore claim more than the data shows.
The missing public table is straightforward: executed miscellaneous transfers by purpose, destination country, economic sector and beneficiary; the number and average value of transfers; approved versus executed amounts; exceptional or legacy settlements; and any classification change that affects year-on-year comparison.
The Central Bank has opened the door by publishing the data. Completing the picture would turn a large aggregate into an auditable public record.
Source note: Central Bank of Libya, *Commercial Banks’ Uses of Foreign Currency, 1 January–31 July 2026*, especially pp. 2, 7, 8, 97, 99 and 103, with the corresponding July 2025 and full-year 2025 reports used for comparison. Calculations are by Mohamed Algarj; rounding may create minor differences.