 Mohamed Algarj
Libya has linked heavy fuel oil sold to private manufacturers and traders to Mediterranean market prices, while allowing eligible domestic industry a discount of 10–15%. Cabinet Decision 550 brings international price movements into industrial fuel bills and gives the National Oil Corporation’s choice of benchmark and discount a direct role in production costs and sales revenue.
The scale of the resource makes the change consequential. Distribution bulletins examined for this article record 465,407 metric tonnes of heavy fuel oil delivered during May–July 2026, before the decision. At a historical 2025 reference price, that volume has a comparative value of $185.23 million. Almost half—228,027 tonnes, or 49%—falls outside the bulletins’ three named categories of electricity, desalination and iron and steel. Identifying those customers is essential to establishing the size of the private market covered by the reform.
The measure connects three economic interests: the state’s return on fuel sales, manufacturers’ energy costs, and the margin available from moving fuel into a higher-priced market. Its financial effectiveness will depend on collection. Its ability to curb diversion will depend on tracing deliveries through to production and inventories. Repricing provides a mechanism to improve revenue; the distribution chain determines whether fuel reaches its authorized use.
Mediterranean prices enter private-sector fuel bills
Decision 550 of 2026 ↗ authorizes the National Oil Corporation, or NOC, Libya’s state oil institution, to sell heavy fuel oil to private industrial and commercial users at Platts Mediterranean reference prices. A 10–15% discount applies to eligible local industrial activities, subject to a decision by the NOC board.
The discount is taken from the international reference price. At a reference of 100, an eligible manufacturer would pay 85–90. The text’s apparent structure leaves commercial purchases at the reference without the industrial discount, subject to the implementing arrangements. Industry therefore retains an explicit price advantage within a market-linked formula.

Heavy fuel oil, or HFO, is a residual petroleum product used in industrial furnaces and some thermal power plants. It is distinct from gasoline, diesel and motor lubricants. The decision does not announce a change in Libya’s retail gasoline or diesel prices.
Platts assessments, published by S&P Global, cover defined markets and product specifications. Fuel oil prices vary with sulfur content, location and delivery terms. The amount billed will depend on the selected assessment, averaging period, exchange-rate convention, transport and charges. A loading-port price differs from a delivered price incorporating freight and insurance. Brega Petroleum Marketing Company is the NOC’s downstream marketing and distribution subsidiary. Platts assessment methodology ↗.
The NOC proposal and the government decision
The proposal appears in NOC letter 6888, dated 1 September 2026, signed in the name of chairman Masoud Suleiman Moussa. The letter cites production, operating and transport costs, international prices and more efficient use. It refers to earlier correspondence dated 3 June, whose original image is absent from the available file. NOC letter ↗.
The cabinet of the Tripoli-based Government of National Unity, headed by Prime Minister Abdulhamid Dbeibah, approved the decision on 2 September. The Cabinet Office forwarded it on 8 September, and the NOC registered it as received on 10 September. The decision takes effect from issuance; transaction and payment records establish when the new mechanism enters actual sales and collection. Forwarding letter ↗.

Chairman of Libya’s National Oil Corporation (NOC).
Source: National Oil Corporation ↗

Prime minister of Libya’s Tripoli-based Government of National Unity.
Photo: Libyan News Agency ↗


465,407 tonnes, with 49% outside the detailed breakdown
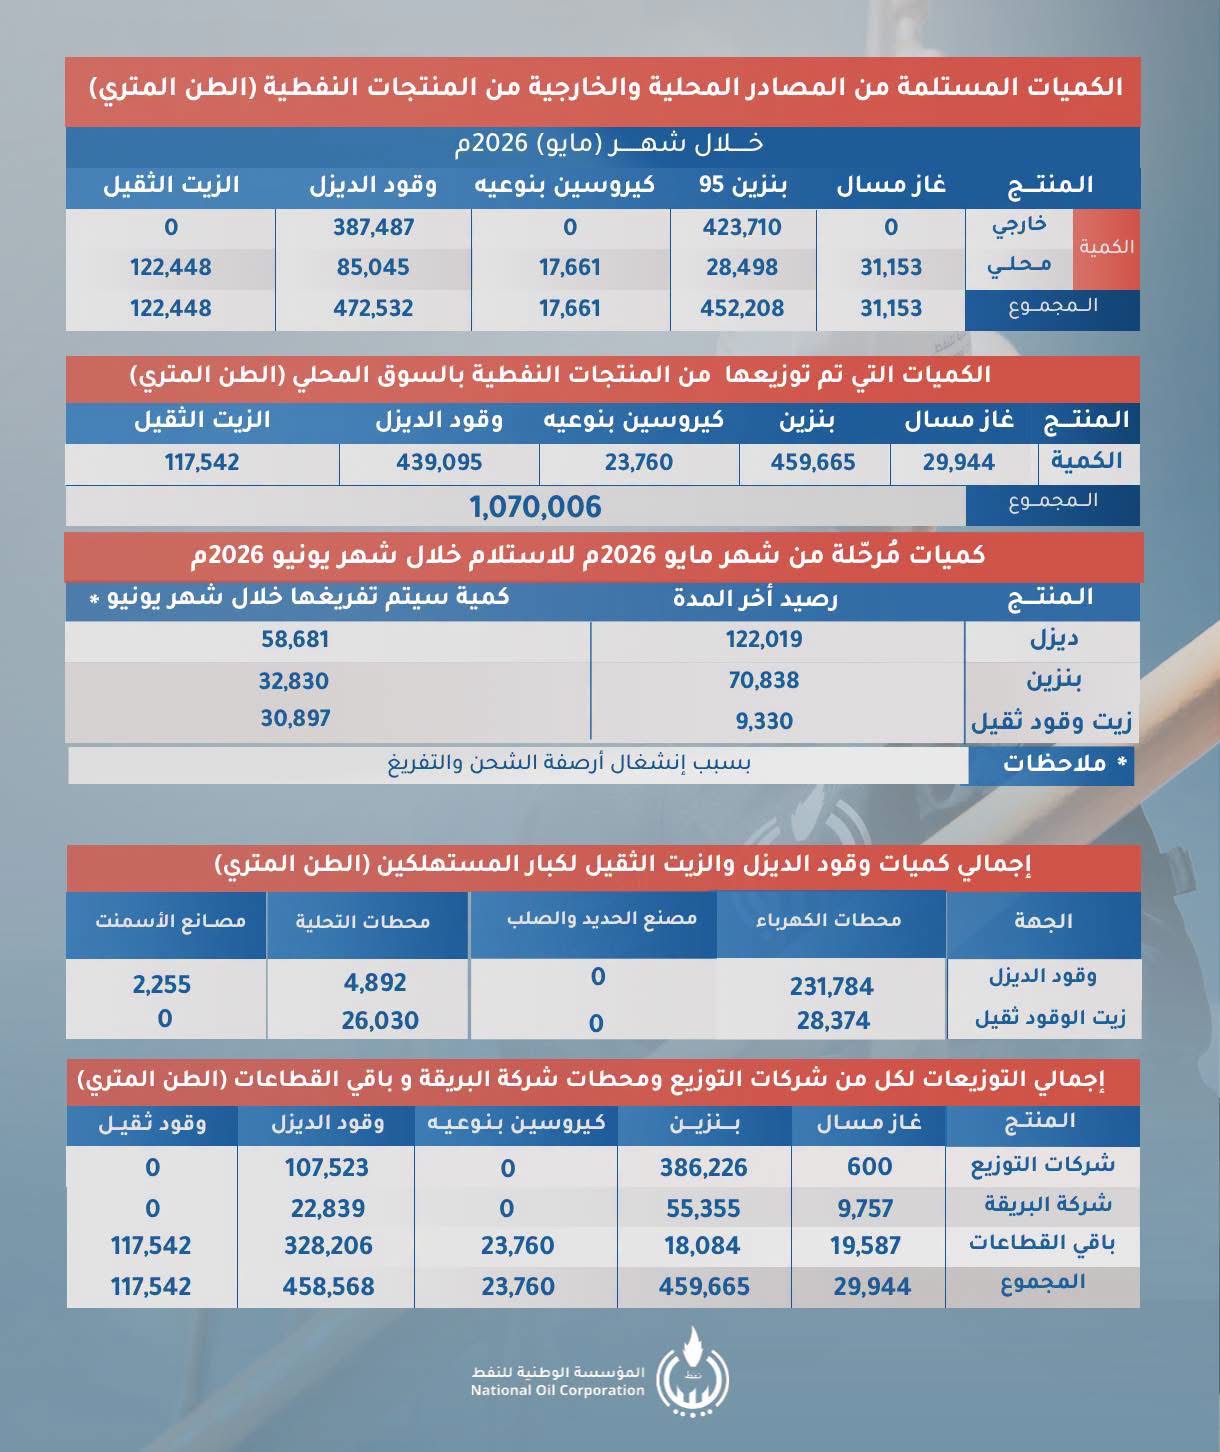
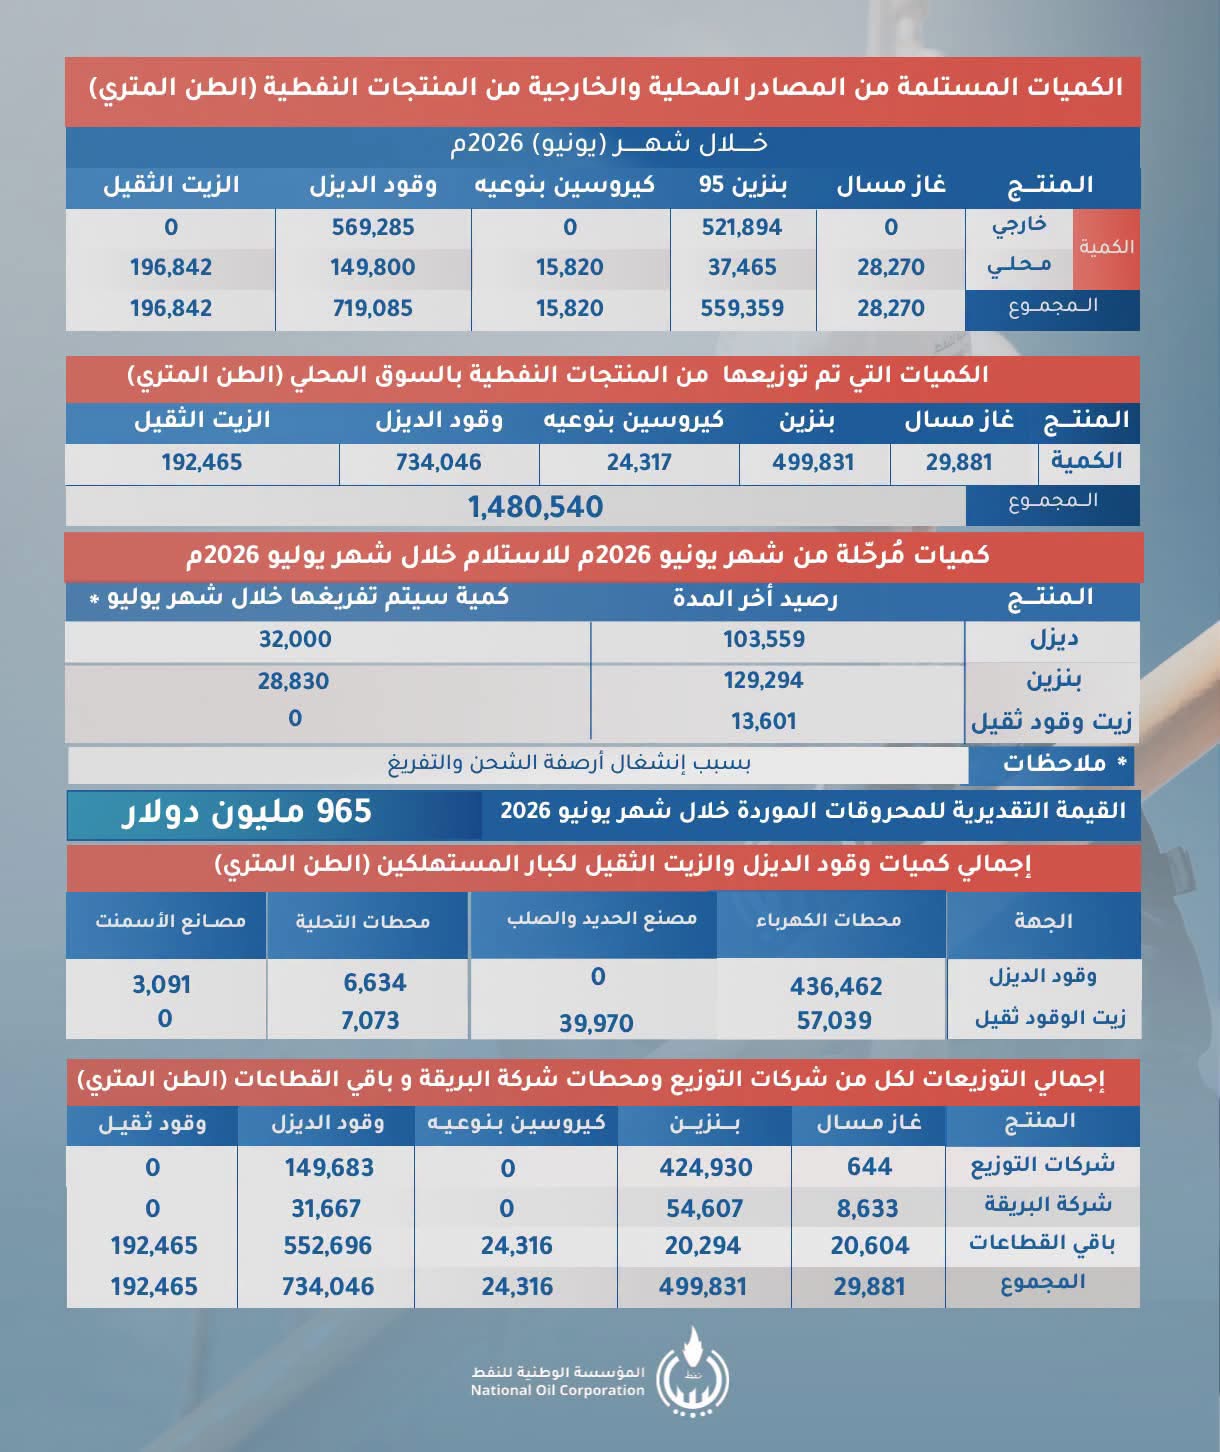
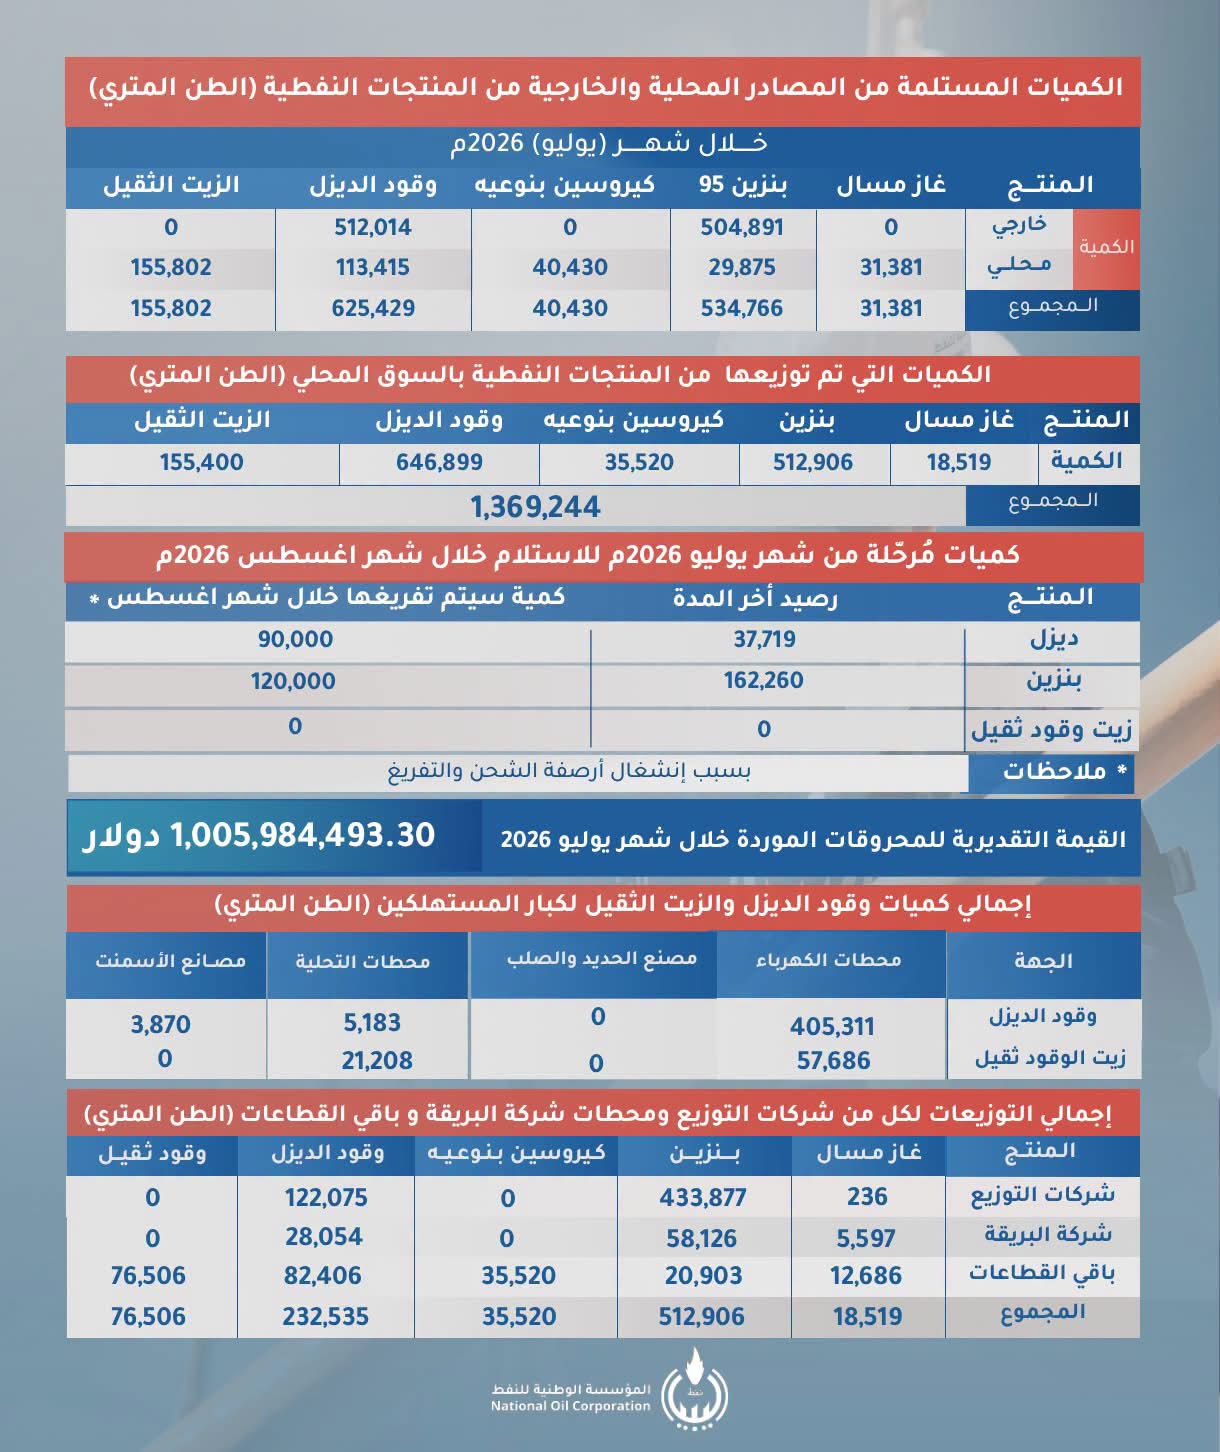
Three consecutive monthly bulletins provide a bounded picture of distribution before the reform. They record deliveries, not fuel actually burned at the receiving facilities.
| Recipient or category | May | June | July | Total tonnes |
|---|---|---|---|---|
| Power plants | 28,374 | 57,039 | 57,686 | 143,099 |
| Desalination plants | 26,030 | 7,073 | 21,208 | 54,311 |
| Iron and steel | 0 | 39,970 | 0 | 39,970 |
| Remainder after the three categories | 63,138 | 88,383 | 76,506 | 228,027 |
| Total distributed | 117,542 | 192,465 | 155,400 | 465,407 |
Sources: May ↗, June ↗ and July ↗ bulletins; author’s calculations. A zero denotes the monthly distribution entry.
Almost half lies outside the three named recipient categories
237,380
Power, desalination, iron and steel
228,027
Calculated remainder after the three categories
The named categories account for 237,380 tonnes, or 51%. The remaining block lacks sufficient detail on recipients’ ownership and activities. Its 228,027 tonnes are therefore neither an established measure of private-sector demand nor an estimate of smuggled fuel. This disclosure gap prevents the reform’s financial coverage from being calculated from the aggregate figures alone.
The bulletins also contain a material presentation inconsistency. In May and June, a lower table places the entire HFO total under “other sectors,” while major recipients appear separately elsewhere. Adding the two sections would double-count fuel. July’s remainder reconciles with the separately named categories. This analysis avoids duplication by subtracting the three named allocations from total distribution.
A $185 million reference value and a multimillion-dollar discount
INA’s annual report records a 2025 average of $398 per tonne for 3.5%-sulfur fuel oil on a Mediterranean loading basis, compared with $444 in 2024. Applied to the recorded distribution, the historical benchmark produces a comparative value of $185.23 million, including $90.75 million for the block outside the three named categories. These figures measure the resource’s scale; the benchmark is not a September 2026 quotation, the NOC’s production cost or collected revenue. INA report, printed page 61 ↗.
Applying the discount to a fixed illustrative volume of 100,000 tonnes shows its financial significance:
| Pricing treatment | Dollars per tonne | Invoices for 100,000 tonnes |
|---|---|---|
| Industrial buyer: 15% discount | 338.30 | $33.83 million |
| Industrial buyer: 10% discount | 358.20 | $35.82 million |
| Commercial buyer: no discount | 398.00 | $39.80 million |
Illustration using the 2025 benchmark, before transport, charges and adjustments. The cases are alternatives and cannot be added.
At this volume, the difference between the two ends of the industrial discount is $1.99 million. Eligibility and rate selection consequently have substantial financial value. Published criteria would make the benefit reviewable and allow comparable industrial activities to be treated consistently.
Incremental billing depends on the eligible volume and the difference between old and new prices. Net results then depend on receipts, costs and arrears. The available file contains no matched customer invoices before and after the decision or subsequent collection statement, and therefore establishes no realized saving.
The bulletins also record 475,092 tonnes received from domestic sources and zero external HFO receipts within their coverage. Repricing that supply does not automatically reduce a dollar import bill. A foreign-currency benefit requires lower imports, feasible additional exports or documented displacement of an imported fuel. The 9,685-tonne difference between receipts and distribution requires inventory and accounting reconciliation; a difference between two flows is not an established loss.
Private industry: production provides the consumption test
The reform’s central relationship is between the manufacturer buying fuel and the state granting an industrial discount. The useful measure is fuel burned per unit of output, with inventories reconciled and all uses identified. Purchases alone mix storage with consumption. An incomplete list of factories can also manufacture an apparent surplus by omitting legitimate demand.
The Intergovernmental Panel on Climate Change assigns residual fuel oil a default net calorific value of 40.4 gigajoules per tonne. A gigajoule is an energy unit; 3.6 gigajoules equal one megawatt-hour of thermal energy. On that basis, 100,000 tonnes of HFO contain 4.04 million gigajoules. IPCC Table 1.2 ↗.
For clinker, the intermediate material ground into cement, the International Energy Agency reports 2022 kiln-energy intensity of 3.6 gigajoules per tonne. The energy in 100,000 tonnes of HFO consequently corresponds to kiln heat for approximately 1.12 million tonnes of clinker. Conversely, producing one million tonnes of clinker would require about 89,100 tonnes of HFO if that fuel supplied all kiln energy at the benchmark intensity. The calculation excludes grinding electricity and other production stages. IEA cement benchmark ↗.
This provides a quantitative industrial audit test. Where fuel burned exceeds the requirement indicated by output, the reconciliation must examine actual kiln efficiency, shutdowns, power generation and other uses. Stronger red flags arise when substantial deliveries continue to a verified idle facility or conflict with its operating and storage capacity. Establishing diversion still requires shipment tracing; a departure from an efficiency benchmark alone does not prove wrongdoing.
The larger, incompletely classified block illustrates the scale at issue. Its 228,027 tonnes contain approximately 9.21 million gigajoules, equivalent to kiln heat for 2.56 million tonnes of clinker, or 896 gigawatt-hours of electricity at 35% conversion efficiency. These are alternative uses of the same energy. The electricity equivalent is almost 29% of Malta’s 2024 supply of 3,106.1 gigawatt-hours. At 30–40% efficiency, the range is 768–1,024 gigawatt-hours. These comparisons describe the resource and do not allocate the whole block to private industry. Malta National Statistics Office ↗.
Linking industrial eligibility to verifiable activity and production protects operating manufacturers from competitors obtaining the same status without comparable production costs. It also gives the discount a measurable industrial purpose while leaving purchase volumes open to scrutiny.
Public facilities: 237,380 tonnes for power, water and steel
The named public-sector allocations represent 51% of distribution in the three months. They remain central to monitoring the overall system, although Decision 550 targets private-sector sales. Converting their fuel into potential outputs illustrates their scale:
| Recipient | Distribution | Illustrative production equivalent |
|---|---|---|
| Electricity | 143,099 tonnes | 482–642 gigawatt-hours at 30–40% efficiency |
| Desalination | 54,311 tonnes | 5.3–7.9 million cubic metres using multi-stage flash technology and the heat assumptions below |
| Iron and steel | 39,970 tonnes | 157 gigawatt-hours at 35% efficiency; about 12.9 days at a full 507 megawatts |
These are engineering equivalents, not measured production. A power-sector assessment must combine HFO with natural gas, diesel and crude used by the plants, and compare all inputs with net generation. Attributing total electricity output to HFO alone distorts the efficiency calculation.
The water calculation uses an International Atomic Energy Agency reference published in 2010, which gives multi-stage flash desalination a heat requirement of 250–330 megajoules per cubic metre. The calculation here assumes that 80–90% of fuel energy becomes useful heat. The process also requires electricity. Actual requirements depend on plant technology and operating condition. IAEA Table 4 ↗.
The iron-and-steel allocation was concentrated in June, with zero distribution recorded in May and July. The Libyan Iron and Steel Company, or LISCO, lists a 507-megawatt steam power station and a 31,500-cubic-metre-per-day desalination plant among its facilities. Assessing its needs therefore requires power and water operations alongside steel production, and recognizes that a delivery may replenish stocks for more than one month. Where electricity and useful heat are produced together, the fuel input must be allocated between them rather than credited in full to each output. LISCO specifications ↗.
The relevant inconsistencies are deliveries unsupported by documented receipt, or fuel reported as burned without corresponding output after outages, efficiency and other inputs are accounted for. Matching depot records, transport, tanks and meters makes public allocations subject to the same scrutiny as private purchases.
August establishes the pre-decision baseline
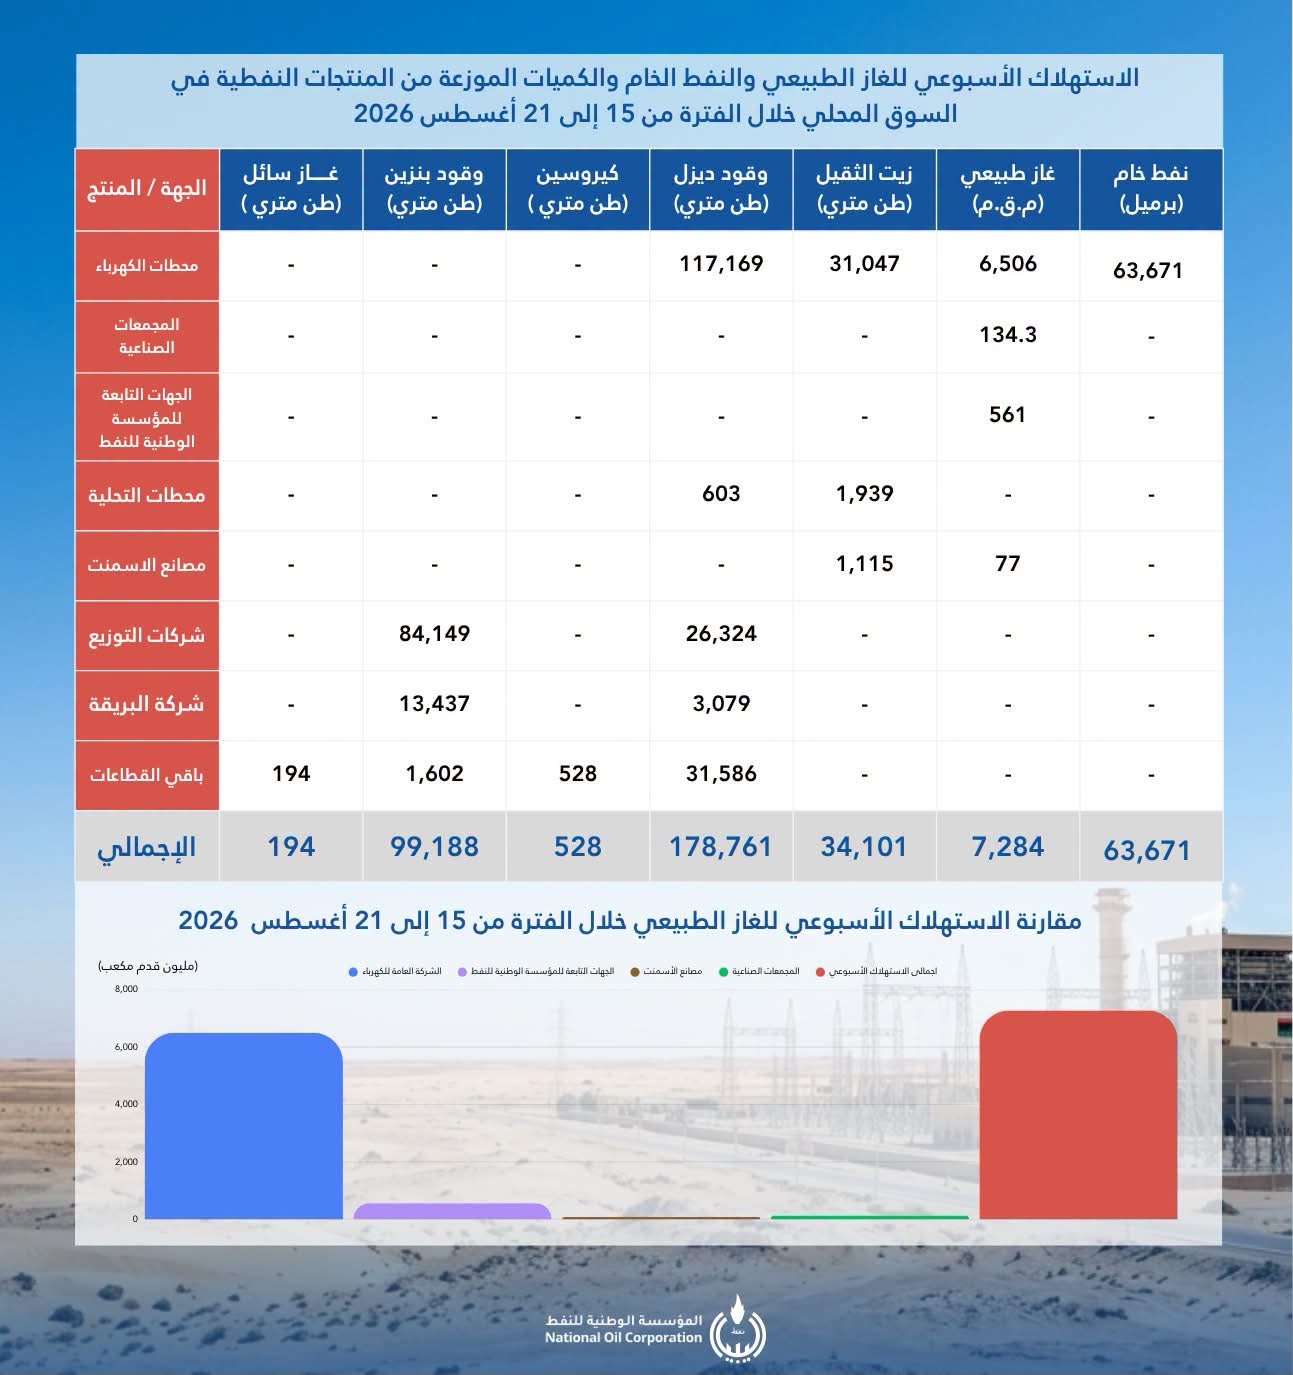
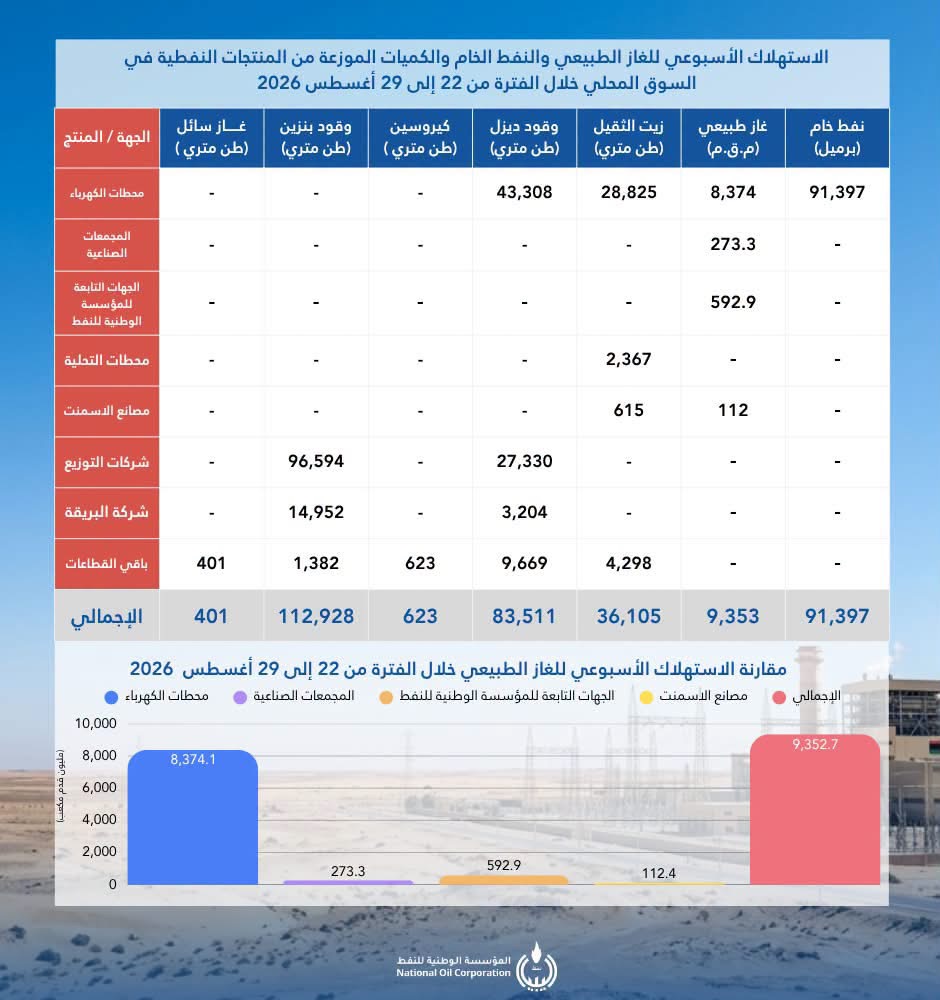
The bulletins for 15–21 and 22–29 August record 70,206 tonnes distributed: 64,178 tonnes, or 91.4%, for electricity and desalination, and 6,028 tonnes for cement and other sectors. This mix differs from May–July, but both periods precede the 2 September decision. They describe the pre-reform position and cannot demonstrate the new price’s effects. Shipment timing, classification and stocks also affect the comparison, and the two periods do not constitute a full month. First bulletin ↗, second bulletin ↗.
Smuggling incentives run through the distribution chain
Diversion becomes profitable when fuel can be acquired well below its resale value elsewhere. Bringing the domestic price closer to the international reference can narrow that margin. If cheaper channels or poorly verified exemptions remain available, pressure may shift toward them, including public-sector allocations. This is a system-design risk requiring scrutiny of all recipients.
The UN Panel of Experts’ 24 March 2026 report, S/2026/224, estimated 1.73 million tonnes of illicit diesel exports from Benghazi old harbour between March 2022 and December 2025. It also reported that only part of the diesel shipments allocated to electricity generation served that purpose. Annex 9 and sub-appendix 9.C ↗.
In Inside Job, published in November 2025, the investigative organization The Sentry estimated $6.7 billion of fuel smuggling in 2024, using a supply, consumption and pricing model. The report records the NOC’s rejection of the estimate and its statement that it does not manage land or sea ports. Printed pages 9–10 ↗.
These provide documented context for distribution risks, with estimates covering different products and periods and, in The Sentry’s case, a disputed value. They do not measure HFO smuggling in the bulletins examined here, cannot be added, and do not turn the 49% lacking detailed classification into a collective allegation.
The clearest investigative priority in this file is to identify the customers in that block, then reconcile each customer’s purchases with production, inventories and shipment movements. The review includes industrial buyers receiving the discount and public facilities with large allocations. This moves scrutiny from an ambiguous aggregate to a specific transaction or discrepancy that can be substantiated or explained.
Industrial effects extend into Mediterranean trade
The decision exposes eligible buyers’ fuel costs to international market movements and the rule for translating the benchmark into domestic currency. Manufacturers may improve furnace efficiency, recover heat or switch fuels. They may also pass costs into product prices, margins or production volumes. Energy intensity, competition, alternatives and liquidity differ, preventing any uniform translation from fuel prices into cement, bricks or other products.
Industrial output is therefore a necessary counterpart to fuel-sales figures. Less fuel per unit of production indicates better efficiency; lower purchases alongside closures indicate contraction. An IMF paper on Libya published in July 2025 recommended phased energy-subsidy reform, clear communication and social protection. IMF paper ↗.
For international suppliers, lenders and industrial partners, benchmark specification and pricing dates acquire direct contractual importance. A consistent rule and dependable collection make the framework commercially usable. Shipment origin, destination and export authorization remain separate matters: paying a higher domestic price does not, by itself, establish that an export cargo is legitimate.
Revenue and production determine the reform’s value
Decision 550 defines the industrial advantage in HFO as a discount from an international price. Its potential lies in making that advantage explicit and calculable, while improving the return on a substantial resource. Effective implementation requires disclosure of the assessment, specification, discount and exchange-rate rule, alongside sales, receipts, arrears and customer-level volumes linked to production and stocks.
Distribution exceeding 465,000 tonnes in three months gives the reform clear fiscal and industrial weight. Its economic value will emerge through collected revenue, viable production and traceable fuel use. Together, those outcomes turn a change in billing into better management of a public resource.
Methodology: This article uses eight supplied images of the decision, correspondence and bulletins, plus original references linked in the text, with an information cut-off of 16 September 2026. The issuing institutions did not independently authenticate the images for this work. Financial calculations are benchmark illustrations rather than implementation results; production equivalents depend on the stated efficiencies and technologies. A complete customer register, post-decision collection figures and measured HFO diversion are unavailable. Annual totals without retrieved original pages were excluded. The NOC response is the historical response reported by The Sentry; no new interviews or requests for comment were conducted.